Setup
Follow the [[installation instructions|Installation]] then make sure the choropleth bundle is enabled:
$ drush en -y visualization_entity_choropleth_bundle
$ drush cc all
Examples Files
Two example files are provided in the examples folder:
africa.geojson
africa-data.csv
Create Visualization
- Look for Content -> Add Content -> Resource in the admin menu and click on it.

- Upload a africa-data.csv file from the examples folder for the resource.
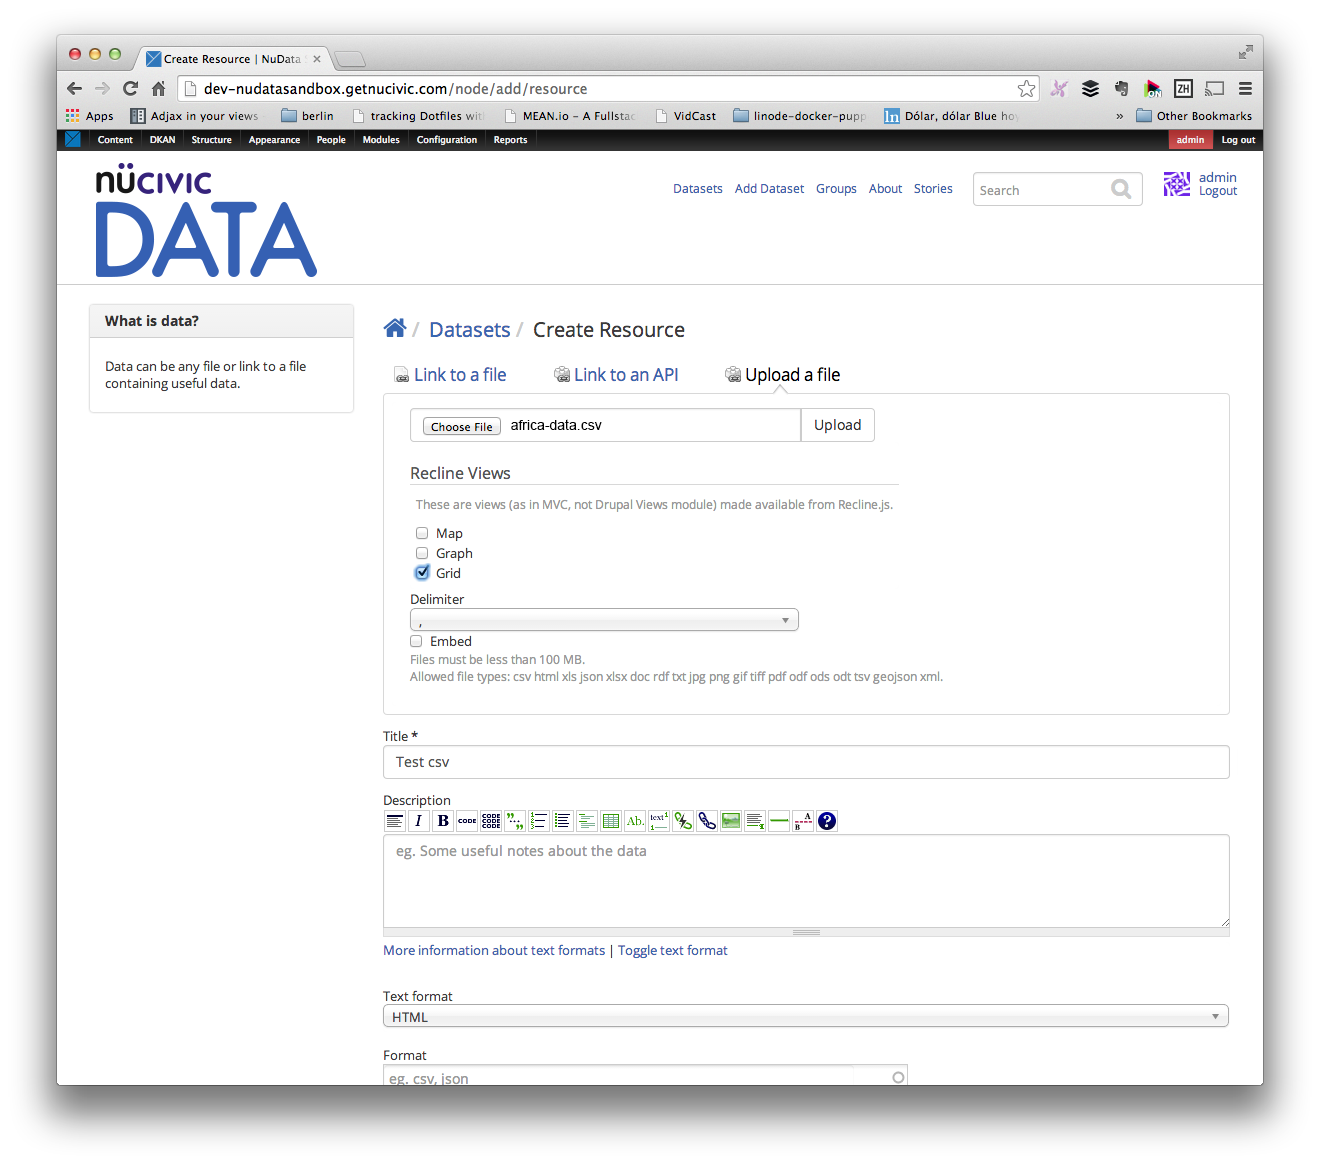
- Fill the required fields and save the resource

- Look for Structure -> Entity Types -> Geo File -> geojson -> Add geojson in the admin menu and click on it.

- Set Title
- Upload a geojson file
- Fill name attribute with the column name in the data (csv resource) that will match the name property for the features in the geojson file.
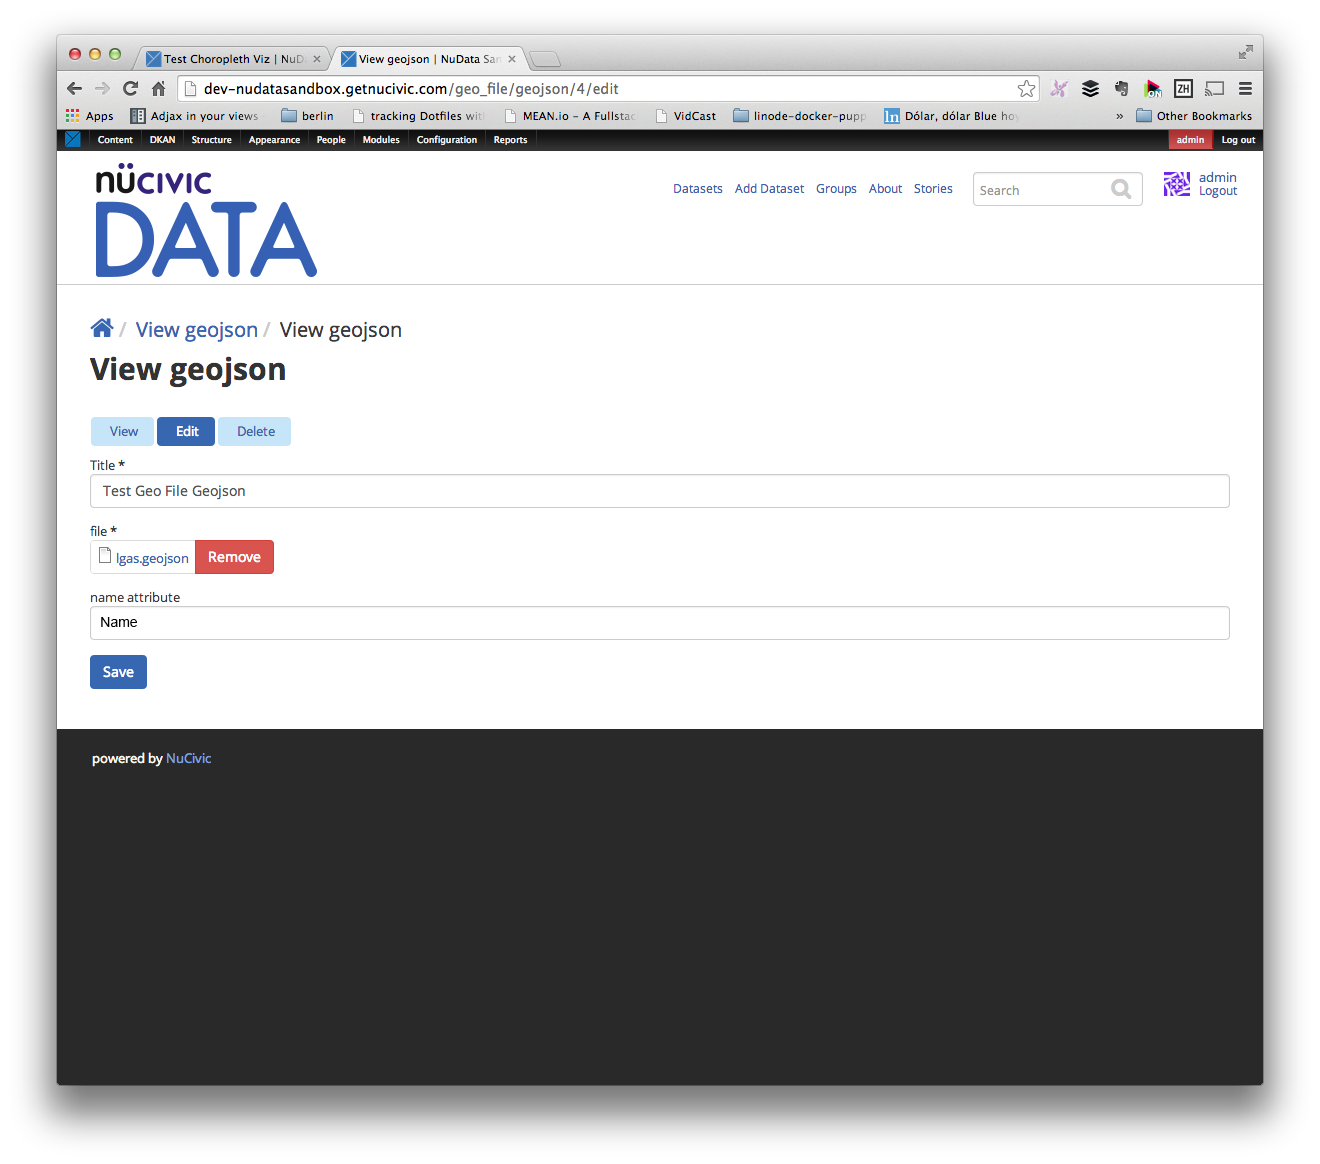
- Click Save.
- You'll get a preview for the geojson file you just uploaded.

- Look for Structure -> Entity Types -> Visualization -> Choropleth Visualization -> Add Choropleth Visualization in the admin menu and click on it.

- Fill Title
- Select the geojson file we created for the geojson field.
- Select the resource file we created for the resource field.

- Select the colors you like to use for the choropleth map.
- Fill data column with the column in the csv data you'll like to pick as the source of numerical data for the polygon coloring. If you leave this field blank, you'll get a list of radio buttons to pick up the column when the visualization gets rendered.
- Fill the data breakpoints with comma separated numbers. If you leave this field blank, breakpoints will be calculated for you based on the data.

- Click Save & Enjoy!
